
The news of the Novo Nordisk (Novo Holdings) intent to acquire Catalent has taken the…

Troubleshooting Bacterial Contamination in Bioreactors
One of the most dreaded problems in large scale biomanufacturing is contamination events.
These events negatively impact an organization in many ways: lost batches and production time, cost of investigations, cost of decontamination, compliance issues (if there is concern that the process is no longer in control), decreased product, patient safety, and lost revenues, depending on the root cause. I was personally involved in successfully defending a recurring contamination investigation before FDA, where any delay in the approval of this blockbuster would have had a negative impact of tens of millions of dollars.
When these events happen, it is essential that organizations access relevant data quickly and seamlessly, and have personnel skilled at quickly sifting through the data and facts to arrive at an actionable root cause. This article will describe the sterile boundary around a bioreactor, the ways in which this boundary can be breached, and methods for identifying the root cause in the event of a breach. The discussion is primarily focused on microbial contamination (i.e., not mycoplasma and viral).
Understanding The Machine And Its Sterile Boundary:
As shown in Figure 1 below, after the initial Steam-In-Place (SIP) event, the sterile boundary around a bioreactor is maintained by:
- Sterile grade filtering of gas flows
- Sterile grade filtering all the liquid feeds to the reactor
- Steaming ports (inlet and outlet) before and after each feed or sampling event (if the sterile boundary needs to be crossed — some sampling systems only require one steaming operation)
- Maintaining a positive pressure (usually by inert gas like nitrogen) in the reactor
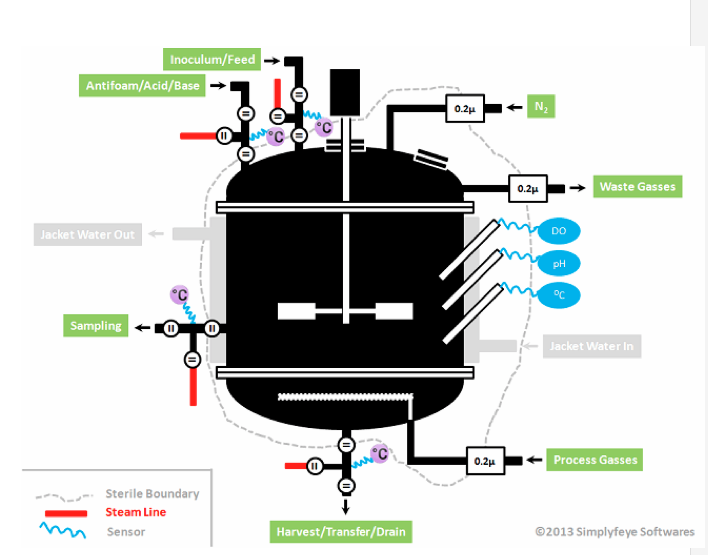
It is called a sterile boundary, even if sterile conditions do not exist on either side of the boundary during operation, because the initial state of the system after SIP was sterile on the bioreactor side. This condition is necessary to produce an axenic (pure) culture during operation, which is critical to robustly producing a consistent and safe product.
Figure 1: Bioreactor sterile boundaries
Modes Of Breach In The Sterile Boundary
The sterile boundary can be compromised in a number of ways. In the following sections, these modes are categorized in the order of their probability of occurrence, based on my personal experience.
More Probable
- Contamination entering from feed/sampling ports: Whenever reactor ports are opened to insert feed or remove samples, the sterile boundary changes and is challenged. For example, the reactor sterility can be compromised if:
- There is improper steaming of the ports, i.e., a port is not sterilized for the required time, or the required sterilization temperature is not achieved
- Micro-cracks develop in the elastomer diaphragms on one of the port valves
- Gaskets or o-rings are missing or improperly seated, or reactor o-rings (head-plate, bottom-plate, man-hole, etc.) are warped
- Failures in drainage or venting occur during SIP, or
- Steam traps are faulty.
Less Probable
- There is an integrity breach of online sterile gas filters, or the filters are not assembled properly prior to the run.
Other Possibilities
- Most of the modes in this category are related to improper bioreactor maintenance, poor reactor design and failing equipment/piping, due to lack of maintenance or age:
- Breach in impeller shaft seals
- Faulty pressure relief valve
- Wetted filter
- Faulty drain system
- Poor reactor design or construction with improper dead legs
- Inadequate Clean-In-Place (CIP) procedures
- Pin-holes or cracks in piping
- Corrosion/pitting
Identifying Root Causes In Process Data
A contamination event in a bioreactor is usually spotted while monitoring the oxygen uptake rate or dissolved oxygen profile of the batch in progress. Information and analysis needed to determine the source of contamination are listed in the following sections.
Dissolved Oxygen Profile
The timing of the sudden drop in dissolved oxygen levels (% D.O., shown in Figure 2 below) can provide data that can be used to estimate the time when the contamination event occurred, as well as its source. The rate of decline in % D.O. can be used to estimate the growth rate (doubling time) of the contaminating organisms. Once a contamination event has been confirmed and the decision has been made to terminate the run, the growth rate can be estimated by turning off aeration and reducing mixing down to a low value (to minimize surface aeration, but maintain mixedness for D.O. probe measurements) and capturing the rate at which D.O. falls at two different time points (e.g., one hour apart). The difference in the rate of decrease can be used to estimate the increase in biomass (i.e., growth rate). Procedures for this practice should be put in place in advance, so that it can be implemented immediately after an event. Any significant delay will result in the oxygen demand of the contamination overwhelming the mass transfer capability of the bioreactor, making execution of this methodology impossible.
By taking a cell count of the contamination from the bioreactor (microscopic counting chambers specific to bacteria are needed), the growth rate estimate can be used to calculate when only one vegetative cell, associated with the contamination event, existed in the bioreactor.
Valve Temperature Profile
Suspected valve temperature profiles (see Figure 2 below) should be checked to determine if a valve was properly sterilized before the feed/sampling event.
Events During The Batch
Reviewing data on events (e.g., sampling, additions, new probes) that occurred within the estimated contamination timeframe can be used to identify the most likely root cause of the event. Some of these may be recorded by data historians or logs, and others may be ascertained from interviews of relevant personnel.
Contaminant Species Identification
Investing in rapid species identification will help identify additional contaminant characteristics such as gram-positive, gram-negative, spore former, pH affinity and motility. The results of this analysis, along with the growth rate estimate, can then be compared to the bioreactor event analysis, significantly reducing the number of events to investigate further. For example, gram-positive bacteria and gram-positive spore formers are more likely to originate from an aeration source or sterilization failures, while gram-negative organisms are more likely to come from water sources.
Elastomeric Diaphragm And Filter CIP/SIP Cycles
This check will help identify if things such as diaphragm valves or filters may have failed/cracked due to overuse.
Past Bioreactor Maintenance History
The past maintenance history should be evaluated for changes and interventions prior to the contaminated batch, or prior to a series of contaminated batches. Particular attention should be given to changes in the sterile boundary and to new equipment and modifications.
Figure 2 shows a sample dashboard demonstrating some of the data analyses outlined in the preceding sections. By using the time a single contaminant cell existed, plus any needed estimate of a lag time (e.g., for sporulation), one can use the information to help rule in or out the three events shown. Understanding the species physiology and the mode of sterility failure is necessary to estimate the lag time. For example, an SIP failure involving a spore former needs to account for the time for sporulation to occur and formation of a vegetative cell.
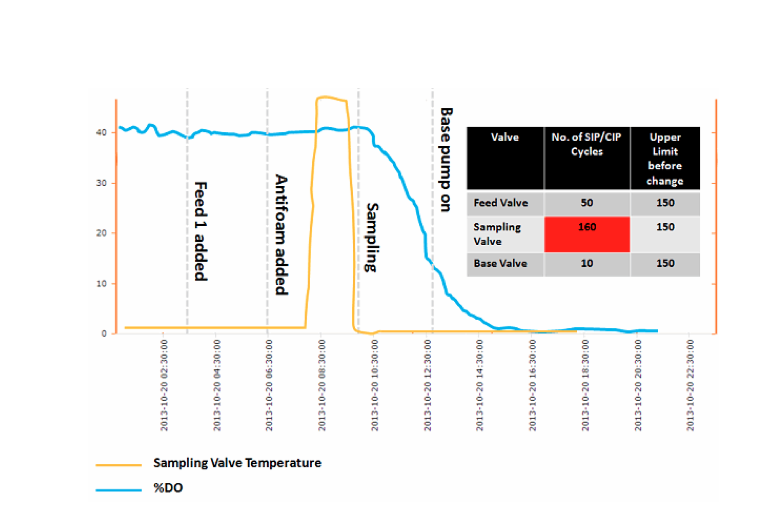
Figure 2: Process Dashboard
The data used for this type of analysis comes from various sources such as:
- QC testing data
- Machine data historians
- Batch records
- Work order records
- Nonconformance management systems
- Training records
Easy access to this data helps the investigator to identify an actionable root cause, so that a (CAPA) Corrective Action Preventative Action can be implemented before the next bioreactor run.
For assistance with microbial or adventitious agent contamination, please contact The Windshire Group at info@windshire.com or (+1) 844-686-5750.

The Founder, President and Principal Consultant of The Windshire Group, Dr. Blackwell has been a prominent industry consultant for over twelve years, working on a wide variety of CMC and quality issues for a broad range of companies and investors, and for all major therapeutic classes. He headed Technical Operations for Shore Therapeutics. Prior to consulting, he held several senior positions in technical operations, manufacturing and process development at prominant product companies. Read More
Related Posts


This Post Has 2 Comments
Leave a Reply
You must be logged in to post a comment.
Great post! Have nice day !
Everything is very open with a really clear description of the
issues. It was really informative. Your website is extremely helpful.
Many thanks for sharing!